Chevron's procurement team was managing transportation contracts across hundreds of terminals entirely through Excel, email, and SharePoint. The process worked, but the manual overhead of maintaining spreadsheets across dozens of carriers left little time for the work that actually mattered: communicating with vendors, identifying better rates, and making informed decisions with accurate data.
In eight weeks, across two phases, I led a team of two designers in building a centralized rate management application that replaced that system. The work required getting alignment on a shifting scope early, advocating for user feedback sessions within a tight timeline, and preserving the structure and meaning behind how the team had organized their data in Excel before we could improve on it. The project reduced manual Excel-based processes by 90% and built the foundation for longer-term automation into the enterprise systems that drive contractor payments and business operations downstream.
Understanding the process before designing anything
We started by getting into the procurement team's daily operations. Through workshops and interviews with both the procurement and transportation management teams, we mapped out the end-to-end process: how rates were negotiated, how approvals moved, and how invoice issues got resolved.
Three personas captured what each role struggled with. Transportation Coordinators were slowed by manual data entry, which made invoice resolution slower and less accurate. Procurement Specialists were managing multiple versions of the same files across email threads, often having to manage file names to ensure they were using the most up-to-date version. Transportation Management Specialists were jumping between tools to piece together information, which created delays on both sides.
As we conducted our discovery calls with the team and users, we started mapping out what the current journey looked like across the different personas and how automating different parts would change the future journey and touchpoints.
Example persona
Multi-actor journey map capturing the MVP 2 and beyond future state for the procurement and approval process. The map surfaced where the three persona paths intersected and where handoffs created friction.
Eight weeks, a moving target, and a scope problem
We had four weeks to deliver MVP designs and four weeks to refine and extend. The expectation was to build the foundation — a centralized rate management repository that replaced the Excel-based system for tracking and managing carrier rates. The approval process, fuel surcharge data integration, and comparison functionality were scoped for later.
As we got into the work, the tech lead kept pushing for the scope to encompass the entirety of the process. The project was designed as a six-month engagement with a second phase focused on automation for the approval process and comparison functionality. If we moved too fast toward the more complex functionality before the core was solid, we risked deprioritizing foundational items to get the work done in the four-week timeline. I facilitated a workshop to reestablish how we would move forward, what were the immediate priorities from all sides and what needed to happen to get us there.
The workshop got us aligned on what the tech team’s backlog looked like, what the project timeline meant, and what was in-app versus out-of-app for the current design phase. We reached a consensus that we’d condense Phases 1 and 2 into an 8-week timeline to help the tech team's timeline.
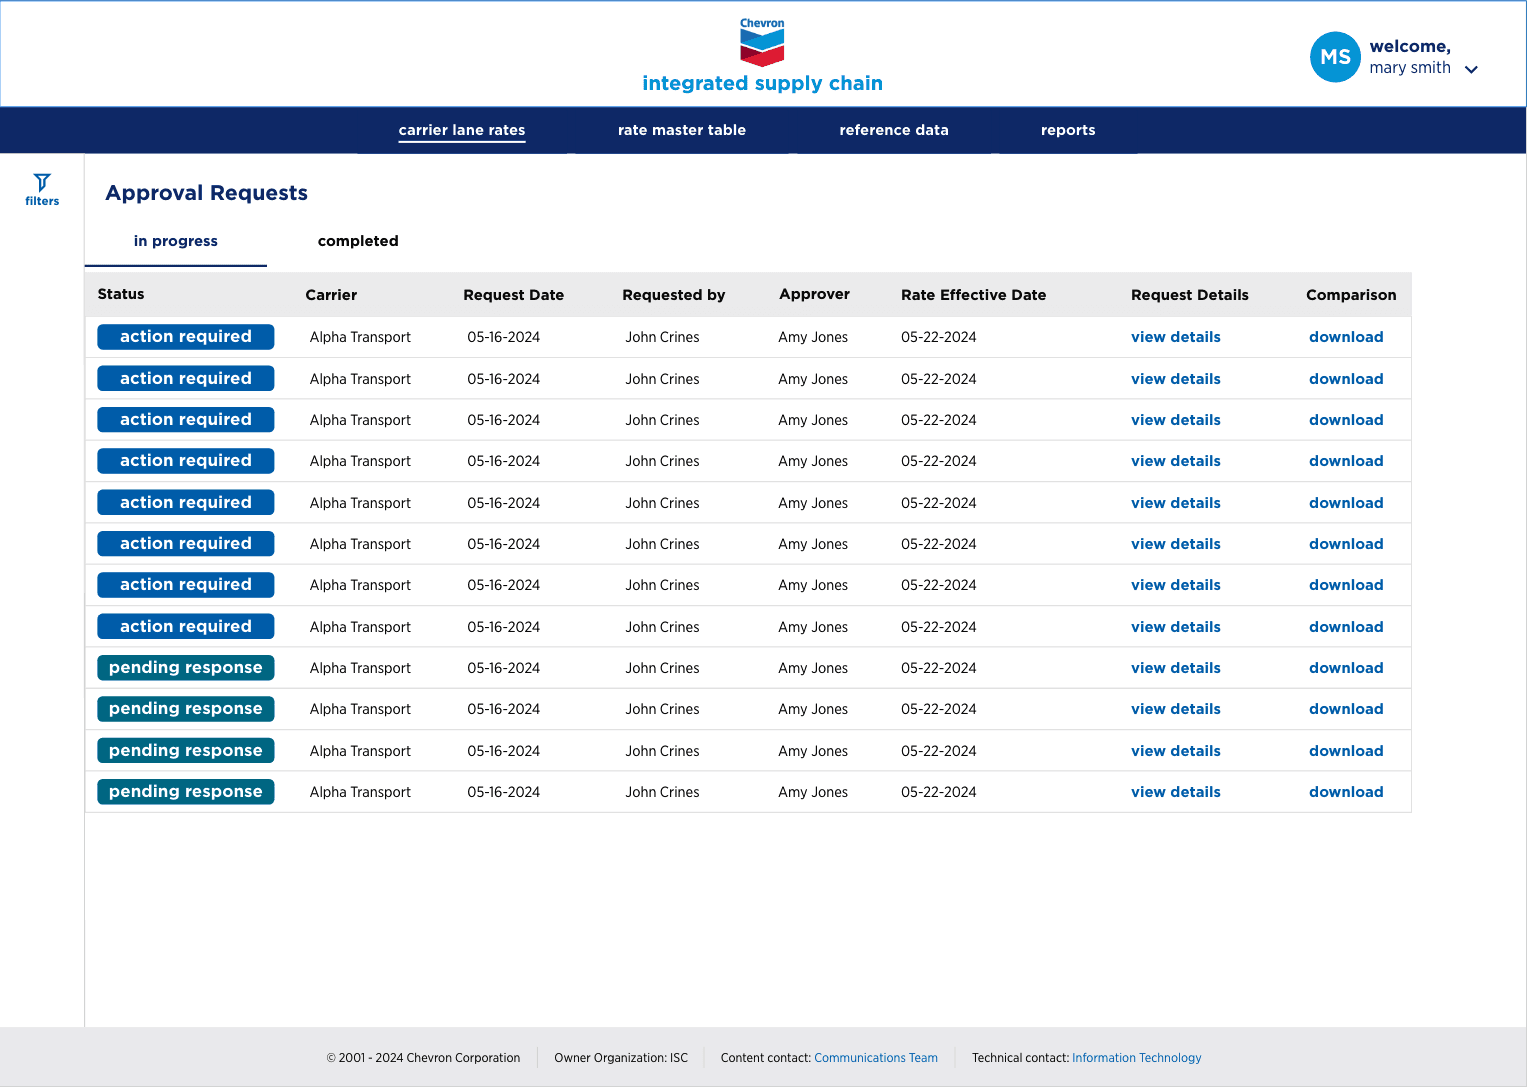
One source of truth for carrier data
The rate repository system provides a centralized view that consolidates six critical data points for procurement specialists and transportation coordinators with the integrated approval process.
We started with low-fidelity wireframes to structure the data and although we weren't scoped for formal usability testing, I advocated for consistent user feedback sessions throughout the process to make sure we weren't drifting from what users actually needed.
We ran three sessions with users across our personas to pressure test the layout and validate that we were surfacing the right data in the right structure before moving to high fidelity. However, we quickly learned that while they often worked from the most recent version of rates, the team also needed to keep all previous data for compliance purposes. This surfaced the need to add versioning to the application so they can see previous iterations of the rates for invoicing purposes.
Coordination that lived in email, brought in-app
The approval process connected procurement and transportation teams who had previously been coordinating entirely through email. We designed a system that lets procurement request approvals directly in the application, track where requests stand, and manage change requests coming back from transportation. Transportation got a dedicated view for incoming requests and a way to communicate changes without going outside the tool.
Fuel surcharge updates had been a weekly manual task: the transportation coordinator would update data in SAP to ensure accurate contractor payments, then export an Excel sheet for invoicing. We simplified the input down to a single data point that automatically updated the surcharge and integrated the email step so the export was no longer necessary.
Carrier comparison and bulk edit gave procurement specialists the ability to assess carriers against each other for competitive rate analysis and make bulk changes without touching a spreadsheet. We mapped out a few approaches, aligned on one, and handed it off for the team to implement and test in production.
Infrastructure the team could actually grow into
The project reduced manual Excel-based processes by 90%. The bigger shift was that the team could finally see their data in one place and collaborate with organized visibility. Versioning and in-app commenting alone eliminated a whole category of back and forth that had been living in their SharePoint files and email for years.
In eight weeks, across two phases, we took a process held together by spreadsheets and email chains and built the infrastructure for something the team could actually grow into.